
While fall has set in, in North America, cryptocurrency markets have followed suit.
Bitcoin made a brief run from 5978 to 7370 from August 14 to September 5, 2018. Those gains were washed away in the span of 24 hours on September 5, 2018.
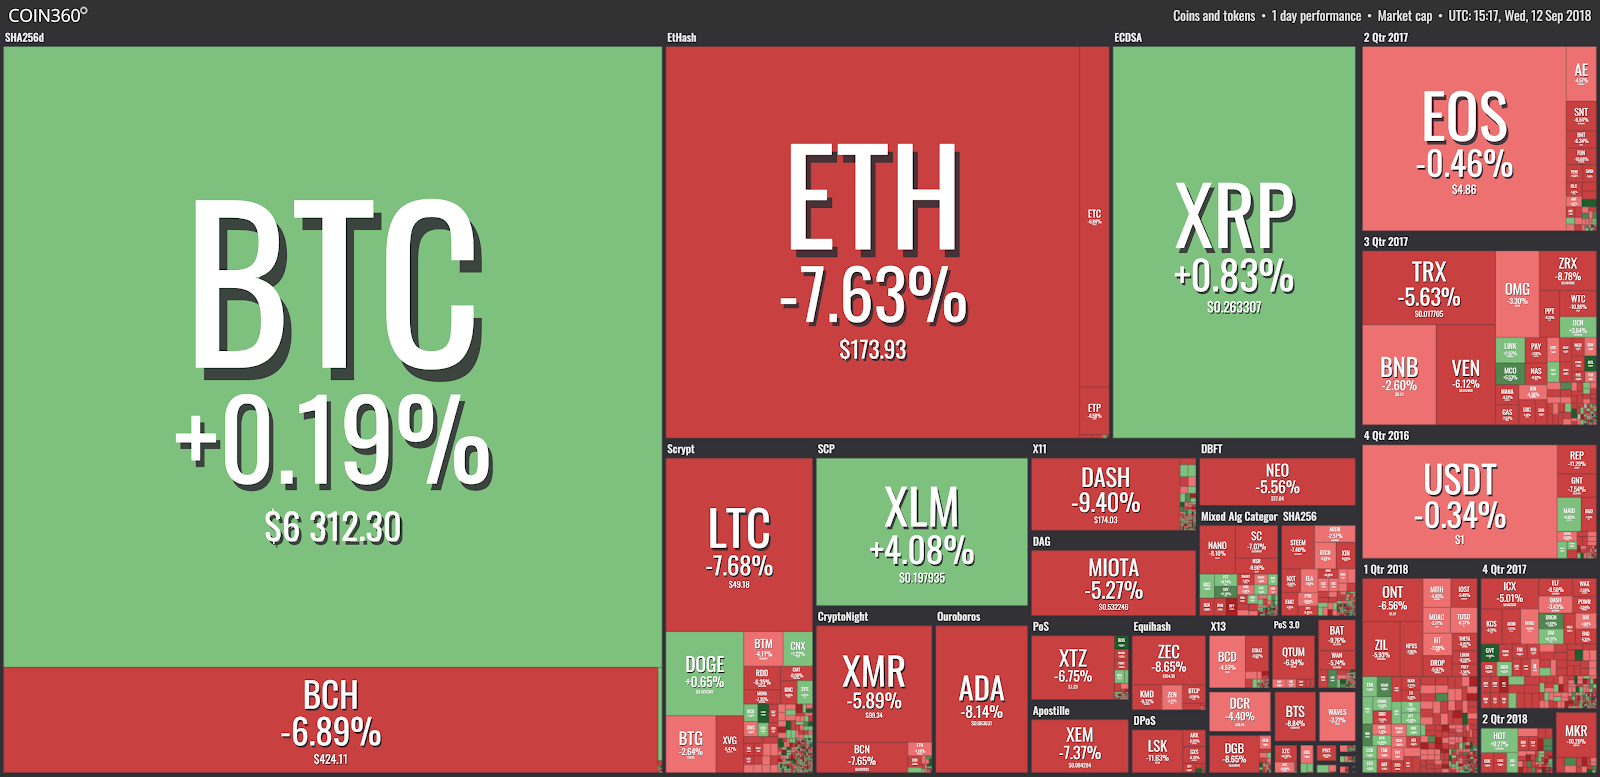
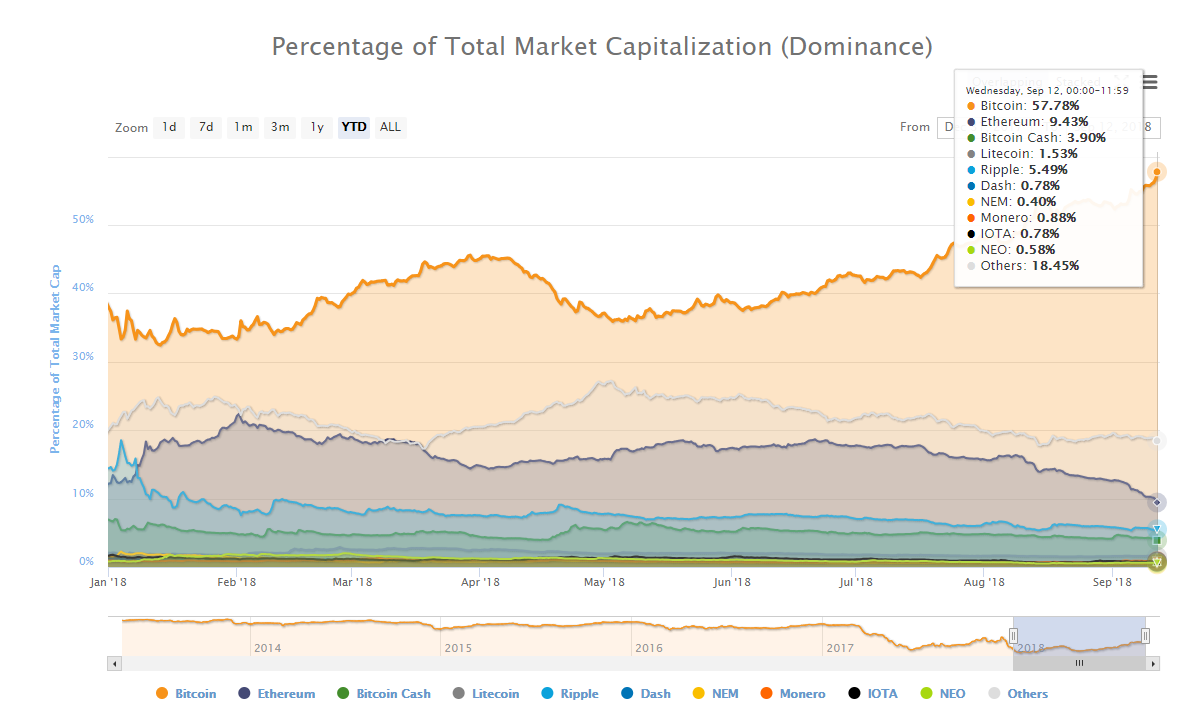
Markets provided a brief reprieve from the downtrend in late august have continued to capitulate. Bitcoin’s market dominance however, is at an all-time high for 57.78%.
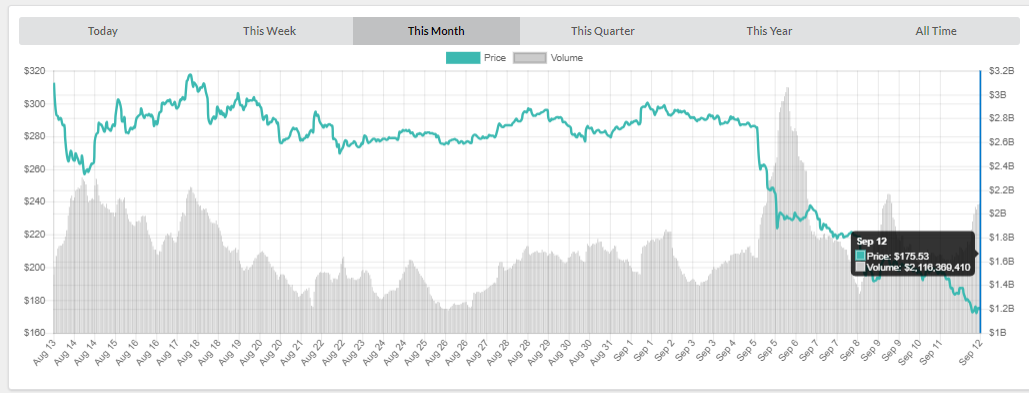
Ethereum’s Blood-Letting
The case for Ethereum is shaping up to be even worse with ICO (Initial Coin Offering) selling their treasuries to stay afloat.
ICOs in a Nutshell
Investors send Ethereum to blockchain projects in exchange for coins in those projects, typically utility tokens to be used on the project’s network or in their distributed application (dApp). Projects, in turn, use the Ethereum collected to fund their project by paying employees in ETH or selling on the open market to fund operations.
2018 is seeing many of these project sell off their coffers in preparation for what could be a deeper dip in it’s price.
Diar’s overview of total ETH tokens in treasuries projects are selling their ETH.
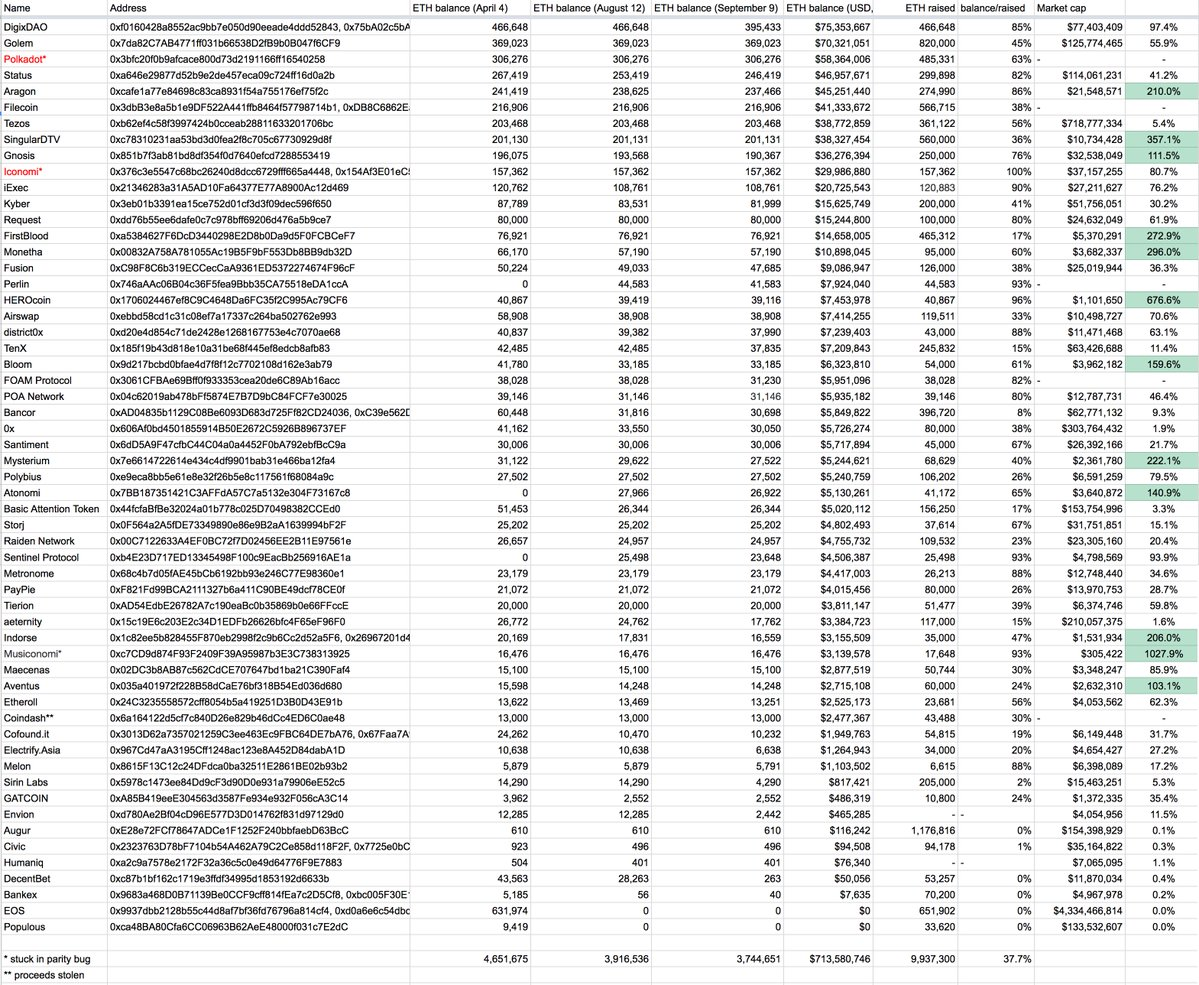
What does this mean for the price of Ethereum? Sell pressure could increase in the short-term as projects look to sell operational ETH.
(Before investing always do your own research, the writer is not an investor advisor, nor should this be deemed financial advice.)